
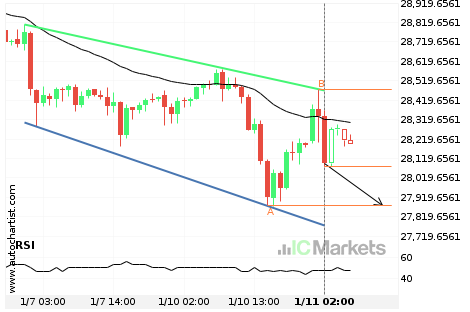
¿Deberíamos esperar una ruptura o una recuperación del Japan 225 Index?
El movimiento del Japan 225 Index hacia la línea de soporte de un Canal bajista es otra prueba más de la línea que ha alcanzado en numerosas ocasiones durante el pasado. Esta prueba de la línea podría ocurrir en las próximas 11 horas, pero no sabemos si dará como resultado una ruptura a través de […]
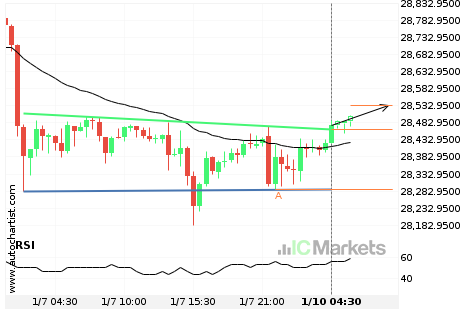
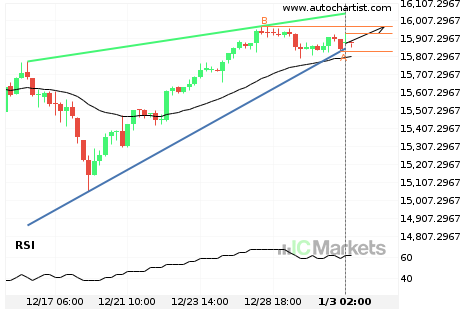
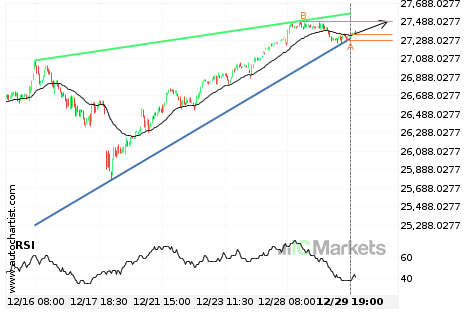
Japan 225 Index – ha irrumpido la línea de resistencia
El Japan 225 Index ha atravesado la línea de resistencia de un patrón de gráfico técnico con un Hombro – cabeza – hombro invertido. Como le hemos visto retroceder desde esta posición en el pasado, deberíamos esperar la confirmación de la ruptura antes de actuar. Ha llegado a esta línea dos veces en los últimos […]
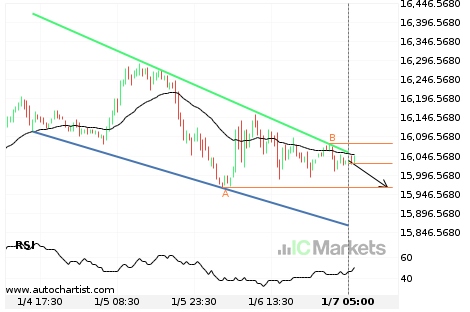
Inminente recuperación o irrupción del Germany 30 Index
El Germany 30 Index se dirige a la línea de soporte de un Cuña descendente. Si este movimiento se mantiene, el precio de Germany 30 Index podría probar el nivel de 15963.7000 en las próximas 18 horas. Ya ha probado esta línea en numerosas ocasiones, por lo que este movimiento podría durar poco y terminar […]
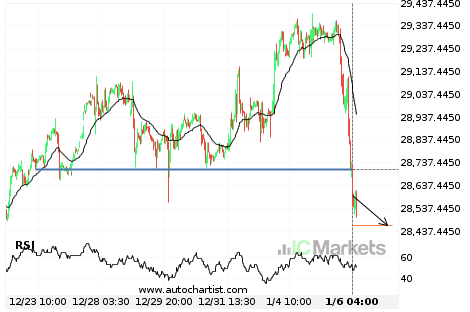
Japan 225 Index – línea de precio psicológico atravesada
El Japan 225 Index atravesó la línea de soporte. Como ya lo hemos visto retroceder desde esta posición en el pasado, deberíamos esperar la confirmación de la ruptura antes de operar. Ha llegado a esta línea en numerosas ocasiones en los últimos 14 días, lo cual sugiere un posible nivel objetivo alrededor de 28462.0996 dentro […]
¿Tendrá el Italy 40 Index suficiente impulso como para irrumpir el soporte?
El Italy 40 Index se dirige hacia la línea de soporte de un Cuña ascendente y puede alcanzar este punto en las próximas 3 días. Ha probado esta línea ya en numerosas ocasiones en el pasado, y esta vez no tendría porqué ser diferente y terminar con una recuperación en lugar de una irrupción. Si […]
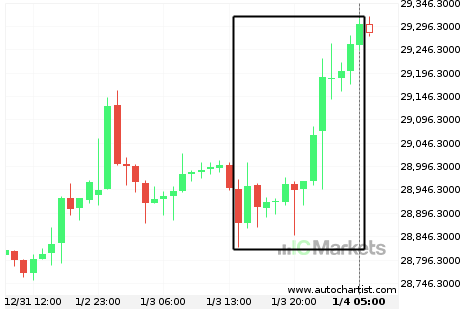
Extraordinario movimiento alcista del Japan 225 Index
El Japan 225 Index ha ascendido un 1,48% de 28.948 a 29.300 en 15 horas.
Inminente recuperación o irrupción del Germany 30 Index
El Germany 30 Index se dirige a la línea de resistencia de un Cuña ascendente. Si este movimiento se mantiene, el precio de Germany 30 Index podría probar el nivel de 15978.4000 en las próximas 3 días. Ya ha probado esta línea en numerosas ocasiones, por lo que este movimiento podría durar poco y terminar […]
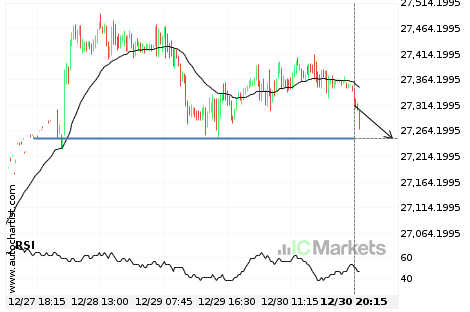
¿Deberíamos esperar una irrupción o una recuperación del Italy 40 Index?
El movimiento del Italy 40 Index hacia la línea de precio 27249.5996 es otra prueba más de la línea que ha alcanzado en numerosas ocasiones durante el pasado. Podríamos esperar que esta prueba ocurra en las próximas 10 horas, pero no sabemos si dará como resultado una irrupción a través de esta línea o simplemente […]
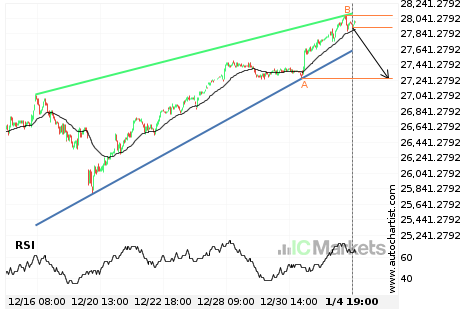
¿Tendrá el Italy 40 Index suficiente impulso como para irrumpir la resistencia?
El Italy 40 Index se dirige hacia la línea de resistencia de un Cuña ascendente y puede alcanzar este punto en las próximas 2 días. Ha probado esta línea ya en numerosas ocasiones en el pasado, y esta vez no tendría porqué ser diferente y terminar con una recuperación en lugar de una irrupción. Si […]
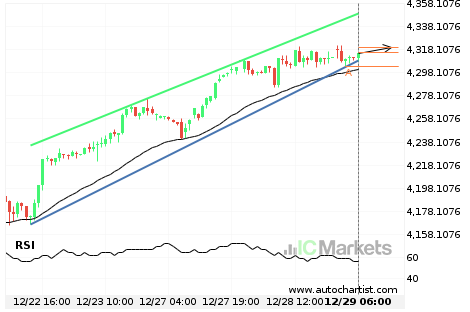
Inminente recuperación o irrupción del EU Stocks 50 Index
El EU Stocks 50 Index se dirige a la línea de resistencia de un Canal alcista. Si este movimiento se mantiene, el precio de EU Stocks 50 Index podría probar el nivel de 4319.4000 en las próximas 2 días. Ya ha probado esta línea en numerosas ocasiones, por lo que este movimiento podría durar poco […]